With last month coming in as one of the warmest Augusts ever observed, 2020 is still likelier than not to be the warmest year on record.
Gavin Schmidt, Director of the NASA Goddard Institute for Space Studies, places the current odds at 63 percent, but he also says that “if La Nina develops further, it’ll be a tossup.”
La Nina is characterized by cooler than normal sea surface temperatures in the tropical Pacific, which tend to depress global average temperatures.
For the record, NASA’s regular monthly analysis places last month as fourth warmest since 1880. Meanwhile, the National Oceanic Atmospheric Administration today announced that August was second warmest. Only August 2016 was warmer in NOAA’s estimation. The agencies use slightly different approaches in their independent analyses, sometimes leading to relatively small differences.
La Nina is Here
Meanwhile, NOAA made it official last week: La Nina conditions were in fact present in the tropical Pacific during August, “and there’s a 75 percent chance they’ll hang around through the winter,” says NOAA’s Emily Becker.
You can get a hint of those conditions in the map above showing global temperature anomalies for the month. Look along the equator in the Pacific: The warmer than normal temperatures seen in most other areas (with some notable exceptions) fade away there, with some cooler than normal conditions right at the equator.

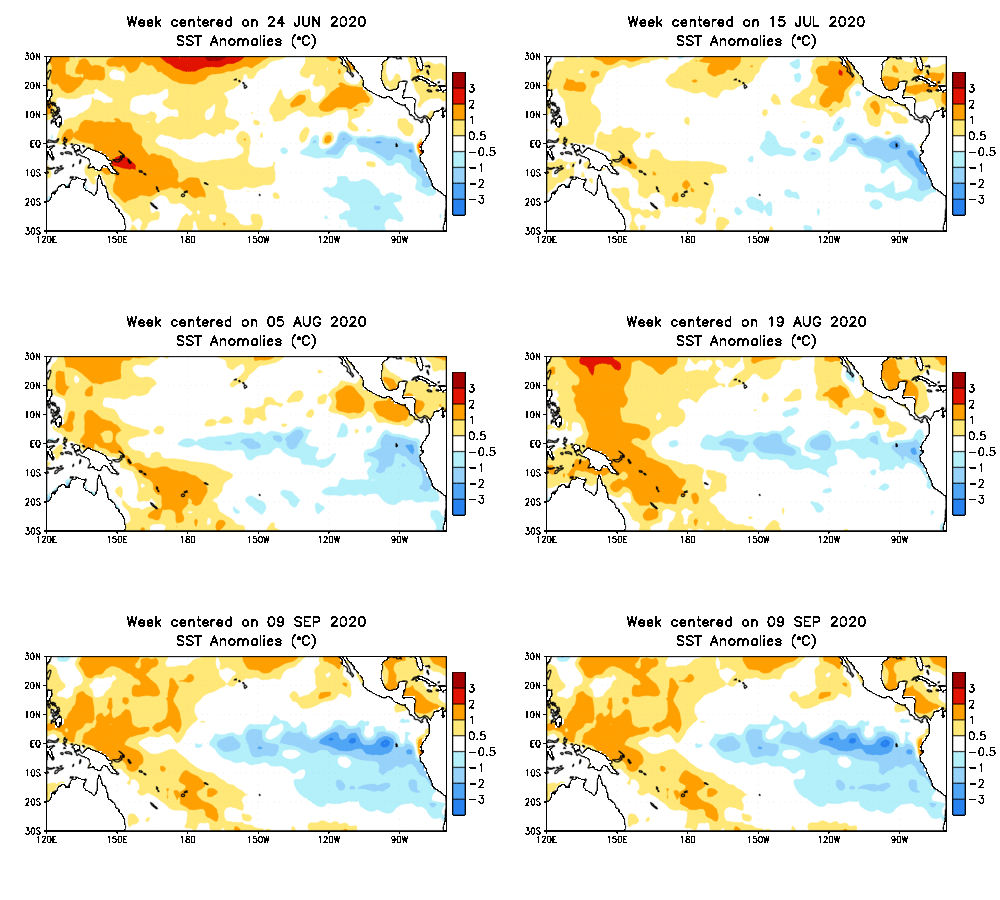
Here’s how sea surface temperatures in the tropical Pacific varied from the long-term average during much of the summer. (Source: NOAA Climate Prediction Center)
The animation above offers an even clearer picture of the cooling in the tropical Pacific. It shows how sea surface temperatures have varied from the long-term average week by week between late June and early September. All that blue shows you just how much cooling has occurred, which played a major factor in NOAA’s declaration of a La Nina.
La Nina (“the child” in Spanish) is the opposite of El Nino (“the boy”), which is characterized by warmer sea surface conditions in the tropical Pacific. Both can have impacts on weather far afield.

Average location of the jet stream and typical temperature and precipitation impacts during a La Nina winter over North America. (Credit: Map by Fiona Martin for NOAA Climate.gov)
As the illustration above shows, we should expect La Nina to affect the weather in the United States in a number of ways this coming winter.
The phenomenon typically does it “through its impact on the Asia-North Pacific jet stream, which is retracted to the west during a La Nina winter and often shifted northward of its average position,” writes Becker at NOAA’s ENSO Blog. “Generally, La Nina winters in the southern tier of the U.S. tend to be warmer and drier, while the northern tier and Canada tend to be colder.”
Over the next few months, the outlook is grim for much of the U.S. West — which has already been suffering from unusually warm and dry conditions leading to widespread drought and exacerbation of raging wildfires this summer.

U.S. drought conditions as of Sept. 8, 2020. (Credit: U.S. Drought Monitor)
La Nina might help in the northwestern part of the Lower 48 states. But the opposite is likely to be true across the southern portion of the region.
How Will 2020 Rank?
Bringing things full circle, the following graph above shows Gavin Schmidt’s current prediction for how the global climate in 2020 will rank:

Here is the current prediction from Gavin Schmidt of NASA for how 2020 will ultimately rank in terms of global temperature. (Credit: Gavin Schmidt via Twitter)
The green dot shows the likeliest result, and the green bar depicts uncertainty.
One thing is already clear: We’ve not seen anything quite like the incredible scope and ferocity of wildfires that have characterized so much of 2020 in the U.S. West, Siberia, and Australia earlier in the year. Heightened wildfire activity like this has been linked by many studies to human-caused climate change.
And no matter how 2020 ultimately compares to previous years, there is no question that it will be one of the warmest years ever observed.


