Image copyright
Getty Images

Twenty-five years of satellite observations have been used to reconstruct a detailed history of Antarctica’s ice shelves.
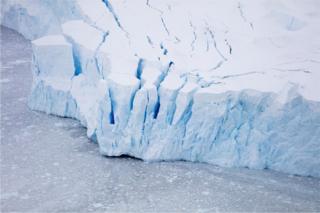
These ice platforms are the floating protrusions of glaciers flowing off the land, and ring the entire continent.
The European Space Agency data-set confirms the shelves’ melting trend.
As a whole, they’ve shed close to 4,000 gigatons since 1994 – an amount of meltwater that could all but fill America’s Grand Canyon.
But the innovation here is not so much the fact that the shelves are losing mass – we already knew that; relatively warm ocean water is eating their undersides. Rather, it’s the finessed statements that can now be made about exactly where and when the wastage has been occurring, and where also the meltwater has been going.
Some of this cold, fresh water has been entering the deep sea around Antarctica where it is undoubtedly influencing ocean circulation. And this could have implications for the climate far beyond the polar south.
“For example, there’ve been a couple of studies that showed that including the effect of Antarctic ice melt into models slows global ocean temperature rise, and that can actually lead to an increase in precipitation in the US,” explained Susheel Adusumilli from the Scripps Institution of Oceanography in San Diego.
- Coronavirus severely restricts Antarctic science
- Thwaites: Journey to the ‘doomsday glacier’
- Deepest point on land found in Antarctica
Image copyright
ESA
Mr Adusumilli and colleagues analysed all of the observations made by Esa’s long series of radar altimeter missions – ERS-1, ERS-2, EnviSat and CryoSat-2.
These spacecraft have tracked the change in thickness in Antarctica’s ice shelves since the early 1990s.
Combining their data with ice velocity information from other sources, and the outputs of computer models – the Scripps group has gained a high-resolution view of the pattern of melting during the study period.
As might be expected, there’s been quite a lot of variation, with mass loss and gain, even within the same individual shelf. And the rate of mass loss over time has also gone up and down. But the overall picture is clear: the shelves are wasting.
“We see that melting is always above the steady state values,” Mr Adusumilli told BBC News. “You need some amount of melting just to keep the ice sheet in balance. But what we’ve seen is an amount of melting by the ocean that is more than is needed to keep it in balance.”
The fascinating aspect to this study is that the scientists can also now trace precisely where at depth the melting is occurring. Some of these floating platforms of ice (the biggest is the size of France) extend many hundreds of metres below the sea surface.
The researchers can tell from the satellites’ data whether the wastage is happening close to the thinnest parts of the shelves or at their fronts, or deep down in those places where the glacier ice coming off land first becomes buoyant and starts to float.
“That kind of information can tell us a lot about the melting processes involved, how they’re working – and the effects that meltwater can have,” said Scripps’ Prof Helen Fricker.
“So, it’s not just that the shelves are melting. It’s how they’re melting – and where their meltwater is being injected into the ocean.”
Image copyright
Scripps
Thinning ice shelves do not contribute directly to sea-level rise. That’s because the floating ice has already displaced its equivalent volume of water.
But there is an indirect consequence. If the shelves are weakened, the land ice behind can flow more quickly into the ocean, and this will lead to sea-level rise. This is happening, and has been measured by other satellites.
Prof David Vaughan is the director of science at the British Antarctic Survey. He was not connected with the study which is published in Nature Geoscience.
He told BBC News: “The Scripps team has produced a map of Antarctica that shows thinning around the margin in a strip of mottled red and blue colours. The detail at the coastline is absolutely phenomenal.
“We really can now identify the parts of ice shelves that are most crucial to the story of thinning. There’ll be a lot of oceanographers spending a lot of time looking at where the melting and the thinning is actually occurring, and trying to work out exactly why those areas have been affected.”
Jonathan.Amos-INTERNET@bbc.co.uk and follow me on Twitter: @BBCAmos
Read MoreFeedzy


